
Time Domain AnalysisPrior to the discovery of the FFT and the implementation of the first real time spectral analysers, vibration analysis was predominantly performed by looking at the time waveform of the signal. Although this enabled rudimentary detection and diagnosis of faults by examining the major repetitive components of a signal, complex signals with a multitude of components could not be accurately assessed.
Several techniques can be used to enhance the characteristics
that are otherwise not readily observable from the time waveform.
These include time-synchronous averaging, and auto-correlation
of the signal. Time synchronous averaging uses the average of
the signal over a large number of cycles, synchronous to the running
speed of the machine. This attenuates any contributions due to
noise or non-synchronous vibrations. The auto-correlation function
is the average of the product  . Application
of the auto-correlation function on the time series allows us
to indirectly obtain information about the frequencies present
in the signal. However these techniques only provide a limited
amount of additional information. The need to distinguish between
components of a similar nature or hidden within a complex vibration
signal led to the mathematical representation of these signals
in terms of their orthogonal basis functions, a field of mathematics
whose origins date back to Joseph Fourier's investigations into
the properties of heat transfer.

The advent of the Fourier Series in the early 1800's by Joseph Fourier (1768-1830) provided the foundations for modern signal analysis, a well as the basis for a significant proportion of the mathematical research undertaken in the 19th and 20th centuries. Fourier introduced the concept that an arbitrary function, even a function which exhibits discontinuity's, could be expressed by a single analytical expression. At the time this idea had its detractors within the mathematical fraternity, including some of the more prominent mathematicians of the time, Biot, Laplace and Poisson. However, his research has since been vindicated and has provided the kernel to many advances in mathematics, science and engineering. Fourier was obsessed with heat after his return to France from the warmer shores of Egypt where he partook in Napoleons' Campaign. This probably explains his fervent fascination in the phenonomem of heat transfer. In his principal composition, "The Analytic Theory of Heat", Joseph Fourier established the partial differential equations governing heat diffusion and solved it by using an infinite series of trigonometric functions, the Fourier series. For a continuous function of period 2P, the Fourier series is given by;

where the Fourier coefficients are calculated by,


For a more detailed and informative exposition on the life of
Baron Jean Baptiste Joseph Fourier I suggest visiting the WWW site,
maintained by David A. Keston
from the University of Glasgow, or another site that provides
an excellent index of bibliographies on famous mathematicians
including Joseph Fourier.The
characteristic of the Fourier transform that has made it such
a valuable tool is its ability to decompose any periodic function,
such as machine vibrations or a complex sound into a set of orthonormal
basis functions, of sines and cosines. The coefficients of these
orthonormal basis functions represent the contribution of the
sine and cosine components of the signal at all frequencies. This
allows the signal to be analysed in terms of its frequency componentsas
shown below.
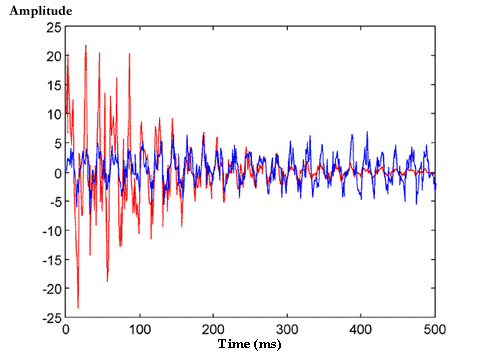
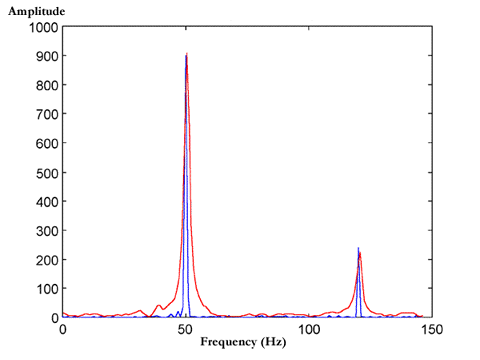
.A major development which revolutionised the computational implementation of the Fourier transform was the introduction of the fast Fourier transform (FFT) by Cooley and Tukey in 1965, which enabled the implementation of the first real time spectral analysers [CIZE85]. The FFT improved the computational efficiency of the Fourier transform of a signal represented by n discrete data points, from an order of n x n to n x log(n) arithmetic operations. Despite the functionality of the Fourier transform, especially in regard to obtaining the spectral analysis of a signal, there are several shortcomings of this technique. The first of these is the inability of the Fourier transform to accurately represent functions that have non-periodic components that are localised in time or space, such as transient impulses. This is due to the Fourier transform being based on the assumption that the signal to be transformed is periodic in nature and of infinite length. Another deficiency is its inability to provide any information about the time dependence of a signal, as results are averaged over the entire duration of the signal. This is a problem when analysing signals of a non-stationary nature, where it is often beneficial to be able to acquire a correlation between the time and frequency domains of a signal. This is often the case when monitoring machine vibrations. Some typical examples include;


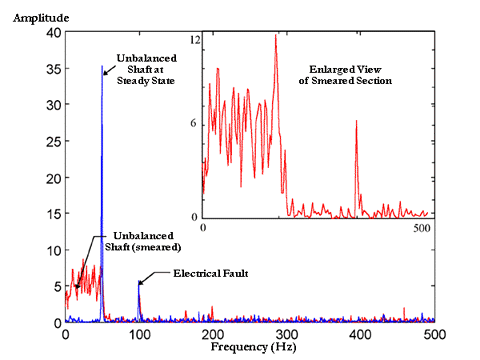
The second example displays the problem of spectral smearing encountered during the start up of an engine. As depicted in Figure 12, spectral smearing substantially effects the results obtained by conventional spectral analysis. Two plots are shown, the red line represents the engine during start up, and the blue line is the same engine after a steady condition has been achieved. The vibrations evident in this figure are due to an unbalanced shaft and a damaged stator. The vibrational frequency of the unbalanced shaft is linked to the rotational frequency of the shaft which results in the spectra being smeared during start up, whereas the fault frequency of the damaged stator is twice the line frequency (ie. 2 x 50Hz = 100Hz).

A variety of alternative schemes have been developed to improve the description of non-stationary vibration signals. These range from developing mathematical models of the signal, to converting the signal into a pseudo-stationary signal through angular sampling, and time-frequency analysis of the vibrations. Before delving into the mathematics and properties of each of these methods a brief exposition of the events leading to our current understanding of time-frequency analysis shall be made.
Time-Frequency Signal AnalysisAs noted by Jean Ville in 1947 [VILL47] there are two basic approaches to time-frequency analysis. The first approach is to initially cut the signal into slices in time, and then to analyse each of these slices separately to examine their frequency content. The other approach is to first filter different frequency bands, and then cut these bands into slices in time and anlyse their energy content. The first of these approaches is used for the construction of the short time Fourier transform and the Wigner-Ville transform, while the second leads to focus of this thesis, the wavelet transform.The wavelet transform is a mechanism used to dissect or breakdown a signal into its constituent parts, thus enabling analysis of data in different frequency domains with each components resolution matched to its scale. Alternatively this may be seen as a decomposition of the signal into its set of basis functions (wavelets), analogous to the use of sines and cosines in Fourier analysis to represent other functions. These basis functions are obtained from dilations or contractions (scaling), and translations of the mother wavelet. The important difference that distinguishes the wavelet transform from Fourier analysis is its time and frequency localisation properties. When analysing signals of a non-stationary nature, it is often beneficial to be able to acquire a correlation between the time and frequency domains of a signal. In contrast to the Fourier transform, the wavelet transform allows exceptional localisation in both the time domain via translations of the mother wavelet, and in the scale (frequency) domain via dilations. Although the wavelet transform has come into prominence during the last decade, the founding principles behind wavelets can be traced back as far as 1909 when Alfred Haar [HAAR10] discovered another orthonormal system of functions, such that for any continuous function f(x), the series

converges to f(x) uniformly over the interval  .
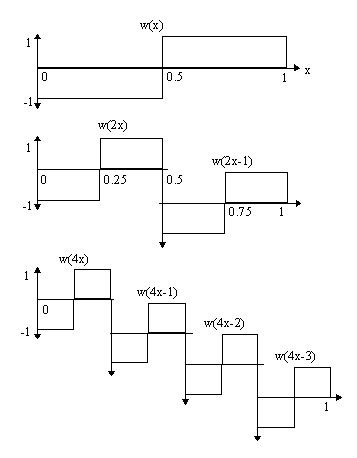
Haar's research led to the simplest of the orthogonal wavelets,
a set of rectangular basis functions depicted in Figure 13. The
Haar basis function was of limited use due to it being discontinuous
in nature. This resulted in it being inefficient in modelling
smooth signals, as many levels need to be included to obtain an
accurate representation.The theories expounded by Haar were extended
on in the 1930's by Levey in the study of Brownian motion where
he used the Schauder basis to examine local regularity properties
that were not accessible via the Fourier transform. A Similar
problem was being tackled by Littlewood and Paley, who were attempting
to localise the contributing energies of a function. They were
interested in whether the energy of a function was spread evenly
over its entire interval or concentrated about a few points. In
order to reveal this information which is hidden within the Fourier
coefficients, Littlewood and Paley discovered a series of manipulations
that could be applied to the Fourier series to retrieve this information.
They introduced the dyadic block
  , a sequence
of operators that act essentially as a bank of band pass filters
with an interval of separation of approximately an octave. The
dyadic block was defined by Littlewood and Paley as,

This allows us to rewrite the Fourier series in terms of its dyadic blocks,

Other contributions to the mathematics laying the groundwork for wavelets during the 1930's include the works of Antoni Zygmund, Phillip Franklin and Lusin.

However it was not until 1946 that the first time-frequency wavelets (Gabor wavelets) were introduced by Dennis Gabor [GABO46], an electrical engineer researching into communication theory. Gabors idea was to break a wave up into segments, and then analyse the individual segments of the wave (wavelets), each of which had a well defined frequency band and position in time. Although Gabor's wavelets worked for continuous decomposition's of signals they were limited in their usefulness as corresponding wavelets for discrete systems did not exist. Shortly after Gabor's work, Jean Ville [VILL47] proposed another approach for obtaining a mixed signal representation. Ville's work was tied into the research of Hermann Wigner (1932), a physicist working in the field of quantum mechanics, and led to the development of the Wigner-Ville transform, given by:
 ,where f(t) is the original time signal.
Unfortunately the Wigner-Ville transform renders imperfect information
about the energy distribution of the signal in the time-frequency
domain, and an atomic decomposition of a signal based on the Wigner-Ville
transform does not exist [MEYE93].The next major step forward
did not come until 1975 when Coifman and Weiss extended Lusin's
work to invent what we now consider the 'atoms' and 'molecules'
which were to form the basic building blocks of a function space,
and the rules of assembly necessary to reconstruct the function
space in its entirety from these 'atoms'. The first synthesis
of these theories leading up to wavelet analysis, and the impetus
for the enormous interest in wavelet theory during the 1980's
and 1990's came from the research of Grossmann (theoretical
physicist) and Morlet (geophysicist). They employed
wavelets to analyse earthquakes and model the process of sound
waves travelling through the Earth's crust, introducing the concept
of using wavelets to analyse signals of a non-stationary nature.
Grossmann and Morlet defined a wavelet as a "function in
L() whose Fourier transform
  satisfies
the criterion
  almost everywhere"
[MEYE93].Following on from this work Yves Meyer, a mathematician
researching into harmonic analysis, developed a family of wavelets
that he showed to be the most efficient for modelling complex
phenomena. The final transition from continuous signal processing
to discrete signal processing was achieved by Stephane Mallat
[MALL89] and Ingrid Daubechies of Bell Labs [DAUB88]. Since then
there has been a proliferation of activity with comprehensive
studies expanding on the wavelet transform and its implementation
into many fields of endeavour. Applications that have been explored
include multi-resolution signal processing, image and data compression,
telecommunications, fingerprint analysis, numerical analysis and
speech processing.