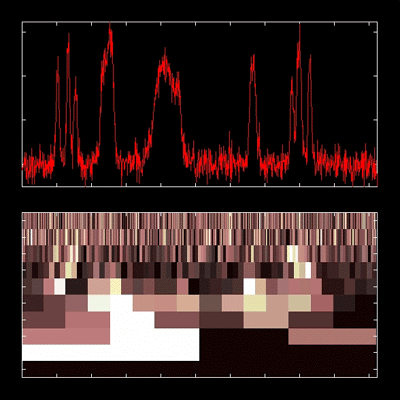
The need for a combined time-frequency representation stemmed from the inadequacy of either time domain or frequency domain analysis to fully describe the nature of non-stationary signals. A time frequency distribution of a signal provides information about how the spectral content of the signal evolves with time, thus providing an ideal tool to dissect, analyse and interpret non-stationary signals. This is performed by mapping a one dimensional signal in the time domain, into a two dimensional time-frequency representation of the signal. A variety of methods for obtaining the energy density of a function, simultaneously in the time and frequency have been devised, most notably the short time Fourier transform, the wavelet transform and the Wigner-Ville distribution. To illustrate the basic idea of how time-frequency analysis can be used to clarify, and provide additional information about the behaviour of a non-stationary signals, a selection of examples are presented below.
Examples of Time-Frequency (Scale) Analysis
The following discussion systematically presents a selection of analytical examples of time varying spectrum, and shows how mapping the time-frequency energy distribution can assist in the examination of non-stationary signals.
Example 1: Discrete Harmonic Signals of Finite DurationThere
are many processes which consist of a variety of discrete harmonic
tones, each of which occupies a particular temporal location.
In this situation it is not sufficient to examine the signal in
terms of its frequency spectrum, as no information regarding the
order in which the notes are played is obtained. Neither does
the time domain provide adequate information, as it is impossible
to ascertain the contributing frequencies at a given point in
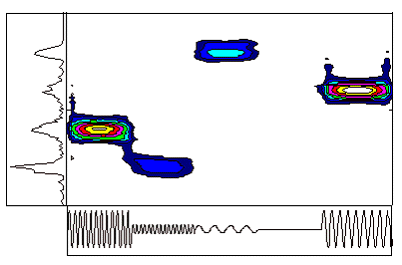
time, except for trivial cases. Figure 15 below shows two markedly
different signals, comprising of notes played in varying order
and magnitude. Examination of the time domain of each of the signals
clearly demonstrates their differences and their time varying
nature, however the spectral content of these signals remains
predominantly concealed. On the other hand, as can be seen from
the frequency domain of the signal analysed, despite the differing
nature of these signals, the power spectrums cannot be differentiated
and provide little information as to the true nature of the signals.

Example 2: Machine Start Up (Chirp Signals)A common scenario
when monitoring the condition of a machine is to examine vibrations
during start up or shut down. Additional information can often
be obtained by resonances and the presence of non-synchronous
vibrations. To begin with consider the simplest case, the basic
"chirp". Figure 16 demonstrates a chirp signal of constant
amplitude evolving over time.
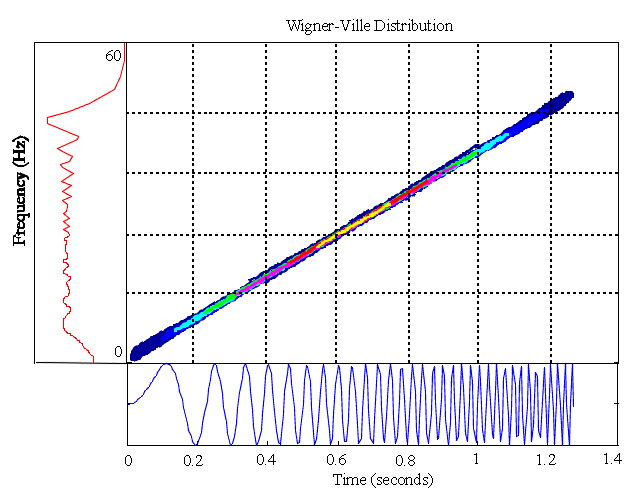
It should be noted for a simple case like this, the time frequency
distribution provides little or no benefit over order domain analysis
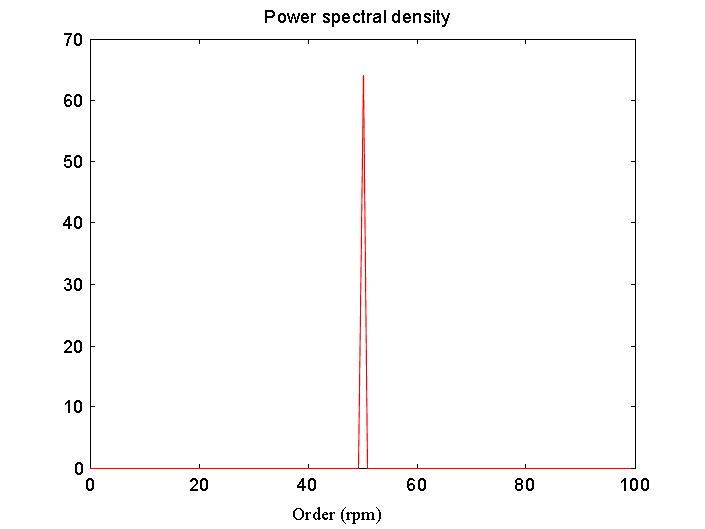
of the signal. The order domain representation of this signal
is shown in Figure 17, which clearly depicts a vibration occurring
at the fundamental running speed.
A more realistic example would include structural resonances,
which result in increased vibrational levels at the resonant frequencies.
In this situation the provision of a time frequency distribution
is invaluable, providing an indication of suitable operating speeds
and assisting designers determine where modifications may need
to be made. Figure 18 below displays the time-scale distribution
of a signal that passes through a resonance Although the time
domain clearly indicates the presence of the resonance, it does
not provide a full description of the nature of the structural
resonance. In order to more fully understand and implement structural
resonances it is necessary to form a time frequency distribution
of the vibrations. Unlike in the previous example, order domain
analysis is inadequate, as information regarding the magnitude
of the vibration at particular frequencies is lost.
Example 3: Multi-Component Time Varying SignalsMulti-component
non-stationary signals, whose time varying qualities differ, add
a degree of complexity that can only be adequately addressed by
examining the signals time frequency distribution. Multi-component
signals consist of two or more discrete harmonic tones. This in
itself is not a problem, however when coupled with fundamental
driving forces of differing nature (eg. Synchronous and asynchronous
vibrations), resolving these components can be extremely difficult.
It is not sufficient to examine vibrations, which contain vibrations
of both synchronous and asynchronous nature, in the angle domain,
as this would simply smear the content of the asynchronous vibrations.
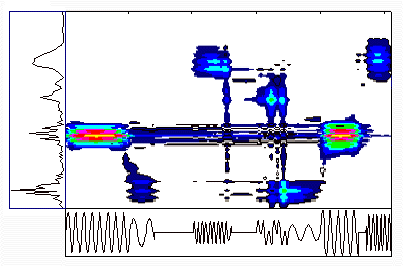
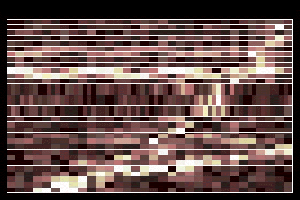
An example is shown below indicating the usefulness of representing
multi-component signals with variable properties in the time-frequency
(scale) domain.
Example 4: Transient Signals
The final example presented in this section is the analysis of
transient signals. This is the area in which time-frequency analysis
has been most widely applied, as no other means of analysis can
provide an accurate picture of transient vibrations. Transient
signals are of short time duration and totally varying in nature
(amplitude, frequency, phase) as shown in the example below. Transients
are commonly found in condition monitoring applications, including
vibrations from slew cranes, excavators, helicopter gearbox transmission
systems[FORR96], internal combustion engines [ANVA94], and slip-stick
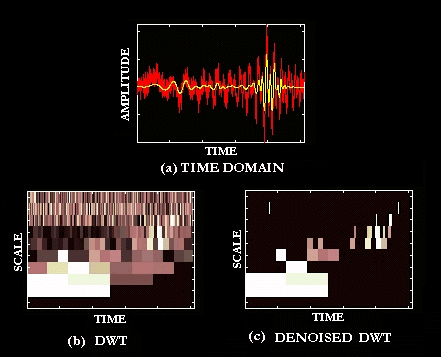
noise. Figure 20 shows the time domain signal caused by impactive
bumps, and its corresponding time-frequency distribution.
